Debug first iteration of BERT models
Recall, positive and null NDCG and wrong model output issues.
- Context
- Evaluate ranking functions
- Recall issue
- Positive and null NDGC issue
- Effect of using different model outputs from BERT
I have fine-tuned a BERT model using a simple training routine. I then deployed a simplified cord19 application on my laptop to validate the model. We will investigate some strange results we found in a previous sprint.
Connect to my local Vespa app.
from vespa.application import Vespa

app = Vespa(url = "http://localhost", port = 8080)
Define different query models. bert_index_1 uses the correct output from the BERT model used, which is the probability of the document being relevant. bert was a mistake I made when I used the wrong output to rank the documents. It is still here because it will be part of my investigations later.
from vespa.query import Query, RankProfile as Ranking, OR

query_models = {
    "or_bm25": Query(
        match_phase = OR(),
        rank_profile = Ranking(name="bm25")
    ),
    "or_bm25_bert": Query(
        match_phase = OR(),
        rank_profile = Ranking(name="bert")
    ),
    "or_bm25_bert_index_1": Query(
        match_phase = OR(),
        rank_profile = Ranking(name="bert_index_1")
    )

}
The evaluation metrics that we want to compute.
from vespa.evaluation import MatchRatio, Recall, ReciprocalRank, NormalizedDiscountedCumulativeGain

eval_metrics = [MatchRatio(), Recall(at=10), ReciprocalRank(at=10), NormalizedDiscountedCumulativeGain(at=10)]
Load labeled data. You can download it here.
import json

labelled_data = json.load(open("cord19/labelled_data.json", "r"))
We will need to tokenizer to convert the query string to embedding vector.
from transformers import BertTokenizerFast
tokenizer = BertTokenizerFast.from_pretrained('bert-base-uncased')
Compute evaluation metrics for each query model and each query.
from pandas import DataFrame

evaluations = {}
for query_model in query_models:
    evaluation = []
    for query_data in labelled_data:
        print(query_data["query_id"])
        evaluation_query = app.evaluate_query(
            eval_metrics=eval_metrics,
            query_model=query_models[query_model],
            query_id=query_data["query_id"],
            query=query_data["query"],
            id_field = "cord_uid",
            relevant_docs=query_data["relevant_docs"],
            hits = 10,
            timeout="100s",
            **{"ranking.features.query(query_token_ids)": str(tokenizer(
                        str(query_data["query"]),
                        truncation=True,
                        padding="max_length",
                        max_length=64,
                        add_special_tokens=False
                    )["input_ids"])}
        )
        evaluation.append(evaluation_query)
    evaluations[query_model] = DataFrame.from_records(evaluation)
Organize the data into a nicer format to work with.
import pandas as pd

metric_values = []
for query_model in query_models:
    for metric in eval_metrics:
        metric_values.append(
            pd.DataFrame(
                data={
                    "query_model": query_model,
                    "metric": metric.name,
                    "value": evaluations[query_model][metric.name + "_value"].to_list()
                }
            )
        )
metric_values = pd.concat(metric_values, ignore_index=True)
The recall issue is that different query models were giving different recall metrics, even though they all had the same matching and ranking-phase and were just reordering the top 10 positions.
second-phase {
    rerank-count: 10
    expression: sum(eval)
}
metric_values[metric_values.metric == "recall_10"].groupby(['query_model', 'metric']).median()
It seems that Vespa reorder the top 11 documents, even though rerank-count: 10, as I show below.
Identify which queries are responsible for the difference:
from pandas import merge

recall_measures = merge(
    left=evaluations["or_bm25"],
    right=evaluations["or_bm25_bert_index_1"],
    on="query_id"
)[["query_id", "recall_10_value_x", "recall_10_value_y"]]

recall_measures[recall_measures.recall_10_value_x != recall_measures.recall_10_value_y]
Query two different rank profiles.
query_data = labelled_data[14]

result_bm25 = app.query(query=query_data["query"], query_model=query_models["or_bm25"],
          hits = 10,
         )
bm25_ids = [hit["fields"]["cord_uid"] for hit in result_bm25.hits]
result_bm25_bert = app.query(query=query_data["query"], query_model=query_models["or_bm25_bert_index_1"],
          hits = 10,
          timeout="100s",
          **{"ranking.features.query(query_token_ids)": str(tokenizer(
                        str(query_data["query"]),
                        truncation=True,
                        padding="max_length",
                        max_length=64,
                        add_special_tokens=False
                    )["input_ids"])}
         )
bm25_bert_ids = [hit["fields"]["cord_uid"] for hit in result_bm25_bert.hits]
Check which id is in the BERT top 10 but not in the BM25 top 10:
id_in_bert_not_in_bm25 = [x for x in bm25_bert_ids if x not in bm25_ids]
id_in_bert_not_in_bm25
List the top 11 results from BM25. Notice that the missing doc is in the 11th position.
result_bm25_11 = [hit["fields"]["cord_uid"] for hit in app.query(query=query_data["query"], query_model=query_models["or_bm25"], hits = 11).hits]
result_bm25_11
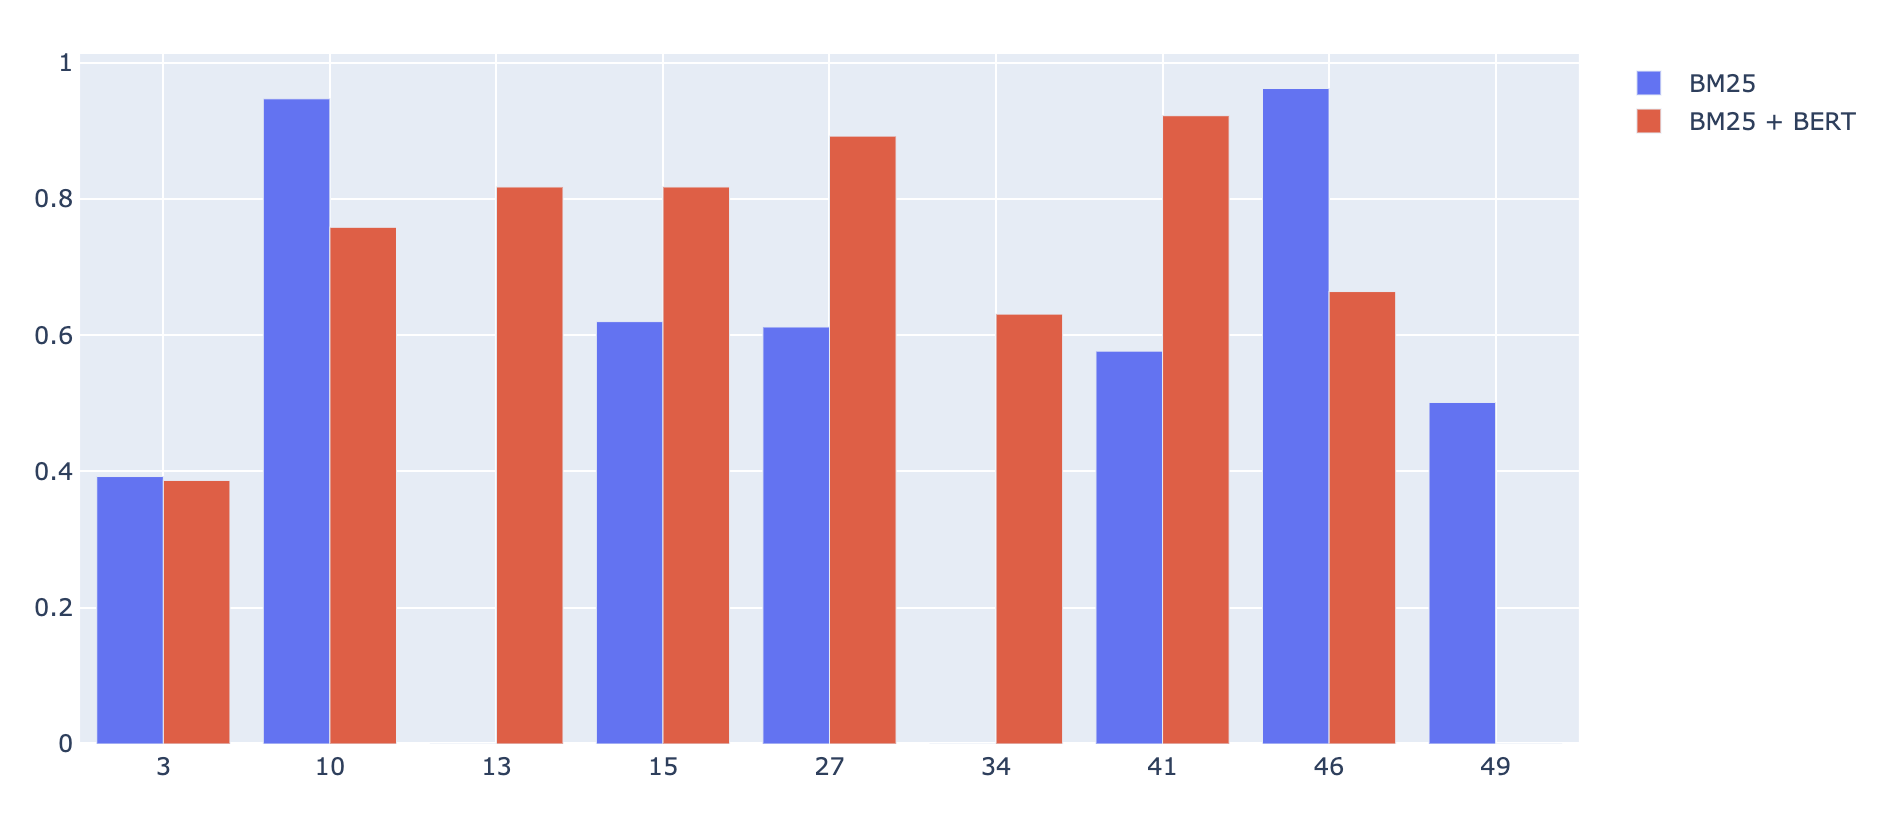
When querying @bergum dev instance I found cases where the NDCG @ 10 was positive for BM25 model and zero for the BERT re-rank model, as we can see in the picture below, which makes no sense.

I could not reproduce the NDCG issue and the results were as expected on my local instance, as I show below.
from pandas import merge

ndcg_measures = merge(
    left=evaluations["or_bm25"],
    right=evaluations["or_bm25_bert_index_1"],
    on="query_id"
)[["query_id", "ndcg_10_value_x", "ndcg_10_value_y"]]
ndcg_measures
import plotly.graph_objects as go
ids=ndcg_measures.query_id.tolist()

fig = go.Figure(data=[
    go.Bar(name='BM25', x=ids, y=ndcg_measures.ndcg_10_value_x.tolist()),
    go.Bar(name='BM25 + BERT', x=ids, y=ndcg_measures.ndcg_10_value_y.tolist())
])
# Change the bar mode
fig.update_layout(barmode='group', xaxis=dict(type='category'))
fig.show()
@bergum dev instance was down, so I could not check his results again, but below is the code I would use it.
from vespa.application import Vespa

app = Vespa(
    url="https://bergum.cord-19.vespa-team.aws-us-east-1c.dev.public.vespa.oath.cloud",
    cert="/Users/tmartins/projects/vespa/pyvespa/docs/sphinx/source/use_cases/cord19/data-plane-joint.txt"
)
from vespa.query import Query, RankProfile, OR

query_models = {
    "or_bm25": Query(
        match_phase = OR(),
        rank_profile = Ranking(name="bm25")
    ),
    "or_bm25_bert": Query(
        match_phase = OR(),
        rank_profile = Ranking(name="bert")
    )
}
from pandas import DataFrame

evaluations = {}
for query_model in query_models:
    evaluation = []
    for query_data in labelled_data:
        print(query_data["query_id"])
        body = {
            "yql": "select * from sources * where userQuery();",
            "query": query_data["query"],
            "type": "any",
            "model.defaultIndex": "default",
            "hits": 10,
            "collapsefield": "title",
            "timeout": "100s",
            "ranking": query_models[query_model].rank_profile.name
        }
        evaluation_query = app.evaluate_query(
            eval_metrics=eval_metrics,
            query_model=query_models[query_model],
            query_id=query_data["query_id"],
            query=query_data["query"],
            id_field = "cord_uid",
            relevant_docs=query_data["relevant_docs"],
            body=body,
        )
        evaluation.append(evaluation_query)
    evaluations[query_model] = DataFrame.from_records(evaluation)
For a moment I thought that the results were similar, nor matter this model output I used. This would indicate a bug. After further analysis I realized that this made no sense, as expected. Using the right model output yielded much better results.
import plotly.express as px

fig = px.box(metric_values[(metric_values.metric == "ndcg_10") & (metric_values.query_model != "or_bm25")], x="query_model", y="value", points="all")
fig.show()